Electromagnetism Resource
6. AC Electricity
6.3. RMS, Peak, Peak-to-Peak and Average Summary
RMS, Peak, and Peak-to-Peak Conversions
The figure shows a summary of the different peak and RMS measurements for a given AC voltage waveform.
The waveform equation is:
\( y = V_{\mathrm{pk}} \sin \theta \)

The table below shows the ratios for conversion between peak, RMS, peak-to-peak and such. For example, to convert an RMS value to a peak value, look up RMS in the left column, then look up Peak in the top row, and look at the value where the RMS row and the Peak column intersect.
| RMS | Average | Peak | Peak-to-Peak | |
|---|---|---|---|---|
| RMS | 1 | \( \frac{2 \sqrt{2}}{\pi} \) (0.9003) | \( \sqrt{2} \) (1.414) | \( 2 \sqrt{2} \) (2.828) |
| Average | \( \frac{\pi}{2 \sqrt{2}} \) (1.111) | 1 | \( \frac{\pi}{2} \) (1.571) | \( \pi \) (3.142) |
| Peak | \( \frac{1}{\sqrt{2}} \) (0.7071) | \( \frac{2}{\pi} \) (0.6366) |
1 | 2 |
| Peak-to-Peak | \( \frac{1}{2 \sqrt{2}} \) (0.3536) | \( \frac{1}{\pi} \) (0.3183) | 0.5 | 1 |
The table below shows the formulas for converting between period, frequency and angular frequency. For example, to convert an frequency to angular frequency, look up Frequency in the left column, then look up Angular Frequency in the top row, and look at the formula where the Frequency row and the Angular Frequency column intersect.
| Frequency \( f \) | Period \( T \) | Angular Frequency \( \omega \) | |
|---|---|---|---|
| Frequency \( f \) | 1 | \( \frac{1}{f} \) | \( 2 \pi f \) |
| Period \( T \) | \( \frac{1}{T} \) |
1 | \( \frac{2 \pi}{T} \) |
| Angular Frequency \( \omega \) | \( \frac{\omega}{2 \pi} \) | \( \frac{2 \pi}{\omega} \) |
1 |
The mains supply in New Zealand is 230 V RMS. The values of RMS voltage, peak voltage, peak-to-peak voltage, frequency, period and angular frequency are as shown below. The values use the conversion factors and formulas provided in the tabels above.
| RMS | Average | Peak | Peak-to-Peak | |
|---|---|---|---|---|
| RMS | 230 V | 207.1 V | 325.3 V | 650.5 V |
| Frequency \( f \) | Period \( T \) | Angular Frequency \( \omega \) | |
|---|---|---|---|
| Frequency \( f \) | 50 Hz | 0.02 s | 314.2 rad.s-1 |
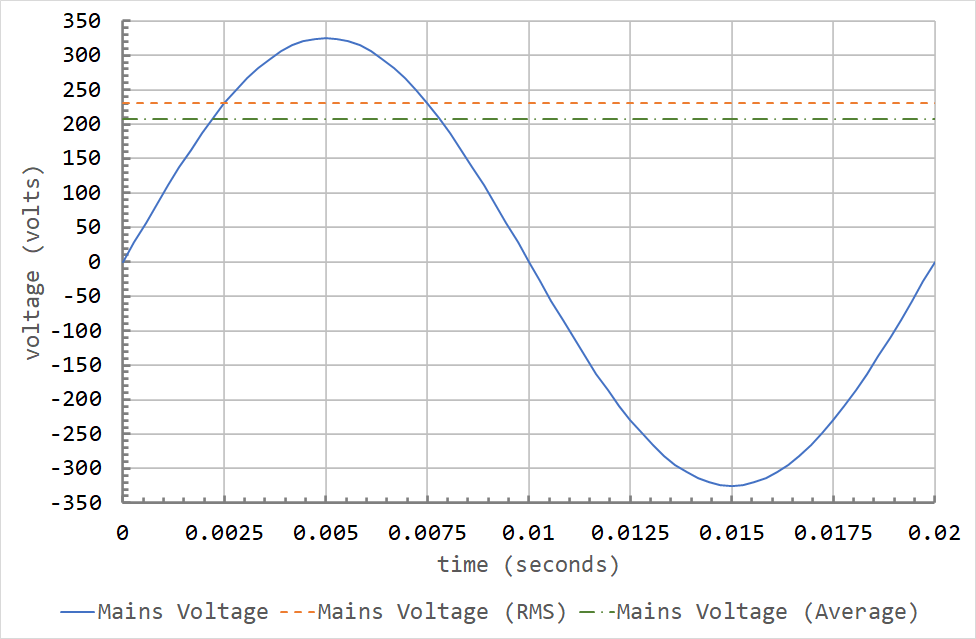
The graph below is a plot of the mains voltage over a single cycle. The cycle length is 0.02 s, since the mains has a frequency of 50 Hz in New Zealand.

It is no coincidence that the RMS value crosses the sine wave at 0.0025 and 0.0075 seconds. These correspond to \( \theta = 45^{\circ} \) and \( \theta = 135^{\circ} \). The sine of both \( 45^{\circ} \) and \( 135^{\circ} \) is 0.7071, which is \( \frac{1}{\sqrt{2}} \).